Band-by-Band Ratings
Which bands are likely to work, and why?
The score combines live solar flux, Kp, X-ray conditions, Bz, solar wind, station-aware local solar time when available, rough path class, and hemisphere-aware sporadic-E seasonality. Each card explains the drivers, but the score is a teaching estimate. It is not a measured path MUF, not a ray trace, and not a promise that your antenna will work.
No station grid is set. Day/night-sensitive ratings are deliberately conservative until you enter your grid, because UTC is not local daylight for most of the world.
Skip Zone / Hops
Why Nearby Stations Vanish
Grey-Line Indicator
Twilight Can Open Low Bands
Near sunrise and sunset, the D-layer decays quickly while higher ionization can remain. That lower absorption can briefly enhance 160m, 80m, and 40m long-haul paths.
Time-of-Day Overlay
Right now it is --:-- UTC
Computing day/night absorption and F-layer support.
Solar Cycle 25
Cycle Context
Loading observed and predicted Solar Cycle 25 context.
Forecast Outlook
NOAA 45-Day Outlook
Waiting for forecast data.
How The Model Reasons
Why The Page Says What It Says
Explaining which inputs are measured directly, which are inferred, and how they are used to build the band ratings.
Verify On The Air
Do Not Worship The Dashboard
The model is only the classroom guess. Before claiming a band is open or closed, compare it with WSPR, PSKReporter, Reverse Beacon Network, NCDXF/IARU beacons, DX cluster spots, and ordinary receiver noise. Then ask whether your antenna takeoff angle, height, polarization, local noise, and power match the path you are testing.
- Measured data: SFI, Kp, X-ray flux, solar wind, alerts, and forecasts.
- Inferred teaching model: rough band score, local solar time effects, path class, hop count, and MUF clue.
- Operator verification: tune the band, check beacons/skimmers, call CQ, and log what actually happened.
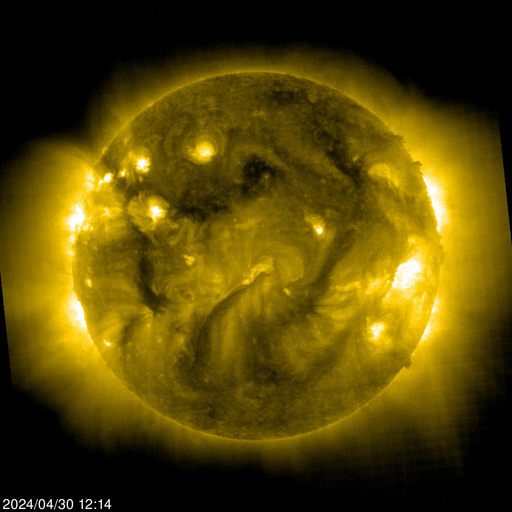
Live Solar Image
SOHO EIT 284 Corona
This extreme-ultraviolet image shows the hot solar corona, including coronal holes and loop structure. It is useful context for solar activity, not a direct band-opening predictor and not a white-light sunspot image; sunspots are photospheric features.